What is a Bearish Harami?
The bearish harami is a popular candlestick pattern that signals potential reversals in an uptrend. This pattern consists of two candles; the first candle is a large bullish candle, followed by a smaller bearish candle that is contained within the body of the first candle. Traders often look for this pattern to create bearish trading opportunities.
Features of a Bearish Harami Candle
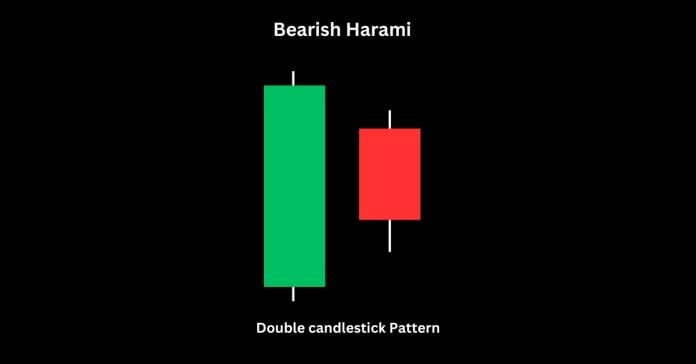
- The first candle must be a long bullish candlestick, showing strong buying activity.
- The second candle is a small bearish candlestick that opens and closes within the range of the first candle’s body.
- The appearance of this pattern near a resistance level increases its significance as a reversal signal.
Trading the Bearish Harami Candlestick Pattern
Successfully trading the bearish harami requires a solid understanding of market trends and indicators. Here are some tips to effectively utilize this pattern:
- Confirm the pattern with additional indicators such as moving averages or RSI (Relative Strength Index).
- Watch for lower volume during the formation of the second candle, indicating declining bullish momentum.
- Place stop losses above the high of the bullish candle to manage risks effectively.
In summary, the bearish harami candlestick can be a powerful tool in your trading arsenal. By recognizing its key features and understanding how to trade it, you can enhance your market strategies and make informed decisions. Happy trading!
Here are 25 frequently asked questions (FAQs) about the Bearish Harami candlestick pattern, along with their answers:
Basics of Bearish Harami
- What is a Bearish Harami candlestick pattern?
A Bearish Harami is a two-candlestick reversal pattern that appears during an uptrend, signaling a potential reversal to the downside. - How does the Bearish Harami pattern form?
It forms when a large bullish candle (green/white) is followed by a smaller bearish candle (red/black) that is entirely within the body of the first candle. - What does the Bearish Harami pattern indicate?
It suggests that the buying momentum is weakening, and selling pressure might lead to a potential reversal. - Why is it called a “Harami”?
“Harami” means “pregnant” in Japanese, symbolizing the second candle being contained within the first candle’s body. - What are the main characteristics of a Bearish Harami pattern?
- A preceding uptrend.
- A large bullish candle.
- A smaller bearish candle entirely within the first candle’s body.
Identification of the Pattern
- How can I identify a Bearish Harami on a chart?
Look for a large bullish candle followed by a smaller bearish candle that fits within the high and low of the first candle. - Which timeframes are suitable for identifying a Bearish Harami?
It can be identified on any timeframe, but higher timeframes (daily or weekly) are more reliable for identifying trend reversals. - What are the colors of the candles in a Bearish Harami pattern?
The first candle is bullish (green/white), and the second is bearish (red/black). - What is the significance of the second candle’s size in a Bearish Harami?
The smaller the second candle, the stronger the pattern, as it signifies indecision or a loss of bullish momentum. - Can the second candle in a Bearish Harami be a doji?
Yes, and a doji increases the pattern’s reliability by indicating market indecision.
Interpretation and Usage
- What market trend does the Bearish Harami typically appear in?
It appears in an uptrend and signals a potential reversal to a downtrend. - Is the Bearish Harami pattern a strong reversal signal?
It is considered a moderate reversal signal, with increased reliability when confirmed by other indicators or price action. - Does the Bearish Harami always lead to a trend reversal?
No, it may fail or result in consolidation instead of a reversal. - What does the Bearish Harami pattern suggest about market sentiment?
It indicates a shift in sentiment, with buyers losing strength and sellers potentially gaining control. - How reliable is the Bearish Harami as a trading signal?
Its reliability improves when used alongside other technical indicators or confirmation signals.
Application in Trading
- How do traders use the Bearish Harami pattern?
Traders use it as a potential entry point for short positions, often waiting for confirmation of the downtrend. - Should the Bearish Harami be used alone for trading decisions?
No, it is best used with other indicators like RSI, MACD, or support/resistance levels. - What are common confirmation signals after a Bearish Harami?
- A bearish candle closing below the Harami’s low.
- Increased volume during the breakout.
- Indicators like RSI showing overbought conditions.
- What is the stop-loss strategy when trading a Bearish Harami?
Place a stop-loss above the high of the first candle in the pattern. - What is the take-profit strategy for a Bearish Harami trade?
Set a target at the next support level or use a trailing stop to capture further gains if the trend continues.
Comparisons and Variations
- How does a Bearish Harami differ from a Bearish Engulfing pattern?
In a Bearish Harami, the second candle is smaller and within the first, while in a Bearish Engulfing pattern, the second candle completely engulfs the first. - What is the difference between a Bearish Harami and a Bullish Harami?
A Bearish Harami signals a reversal to the downside in an uptrend, while a Bullish Harami signals a reversal to the upside in a downtrend. - Can the Bearish Harami pattern fail?
Yes, it can fail if the uptrend continues or if no confirmation follows the pattern. - How does volume affect the Bearish Harami pattern’s reliability?
High volume during the second candle or subsequent breakout enhances the pattern’s reliability. - What role does market context play in interpreting a Bearish Harami?
Context is critical; it is more effective when it appears near resistance levels or after a prolonged uptrend.