Understanding the Long Legged Doji Candlestick
The long legged doji is a unique candlestick pattern notable for its distinct shape, characterized by an elongated upper and lower shadow while exhibiting a small real body. This formation occurs when the opening and closing prices of a security are nearly identical, resulting in a candlestick that conveys minimal net movement. Traders and analysts often identify this candlestick on price charts, particularly in volatile market conditions, where price swings are pronounced.
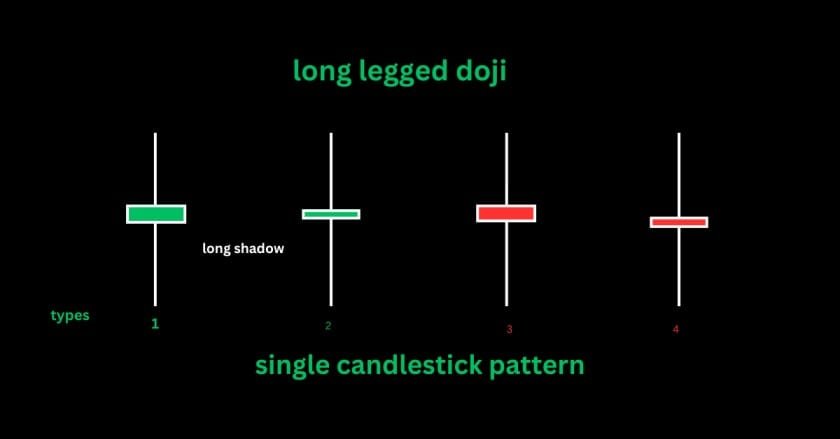
The defining feature of the long legged doji is its long shadows, which signify that price experienced significant movements in both directions during the trading session. The long upper shadow indicates that buyers attempted to push the price higher, but ultimately, sellers regained control and brought it back down to near the opening price. Conversely, the long lower shadow demonstrates that sellers tried to drive the price lower, but buyers intervened, leading to a similar outcome. This duality in price movement reveals the psychological battle between bulls and bears, underscoring a state of indecision among traders.
From a technical analysis standpoint, the long legged doji acts as a pivotal indicator of potential trend reversals or continuation. Its appearance suggests considerable uncertainty, as market participants recognize that neither side holds firm control. Therefore, traders often utilize the long legged doji to inform their decision-making processes. A well-placed long legged doji can signify that a reversal may follow, especially when situated at essential support or resistance levels. By understanding this candlestick’s characteristics and implications, traders can better navigate the complexities of market movements and enhance their strategies for capitalizing on potential trading opportunities.
Market Context: When to Look for Long Legged Doji Patterns
The long legged doji is a significant candlestick pattern that can provide valuable insights into market psychology. Identifying the optimal market context for this pattern is crucial for traders aiming to capitalize on potential reversals or continuations. Long legged doji patterns are particularly noteworthy in trending markets, as they often signal indecision among traders, which may indicate that a shift in market momentum is forthcoming. When these patterns appear at key support or resistance levels, they gain additional significance. Their presence at these critical junctures can suggest that a market reversal may be in process, making them essential signals for traders to watch.
Moreover, traders should consider the broader market scenario when interpreting long legged doji patterns. For instance, in a bullish trend, the appearance of this candlestick pattern might raise a cautionary flag, suggesting that buyers are losing control, while in a bearish trend, it can indicate selling pressure is waning. Analyzing market context helps in discerning the potential implications of the long legged doji as a leading indicator of future price movements.
Volume is another critical factor to consider when assessing the relevance of long legged doji patterns. A long legged doji accompanied by high trading volume can signal stronger conviction within the market participants, thereby increasing the likelihood of a subsequent price change. Conversely, if the long legged doji emerges in a low-volume scenario, its significance may diminish, leading to a weaker signal regarding future price action.
In addition to volume, incorporating other technical indicators can further validate the presence and implications of long legged doji patterns. Tools such as moving averages, momentum oscillators, and trend lines can assist traders in confirming signals and making well-informed decisions. Understanding the market context in which long legged doji patterns appear maximizes their trading efficacy and enhances overall decision-making in the market.
Trading Strategies Involving Long Legged Doji
The long legged doji is a unique candlestick pattern that indicates market indecision, occurring when the opening and closing prices are almost equal, and the price fluctuates within a significant range during the session. To leverage this pattern effectively, traders can implement several strategic approaches that incorporate entry and exit points based on the appearance of the long legged doji.
One common strategy involves entering a trade when a long legged doji appears at key support or resistance levels. In this scenario, traders may opt for a bullish position after a downtrend when a long legged doji forms at a support level, signaling a potential reversal. Conversely, traders may enter a bearish position following an uptrend when the long legged doji appears at a resistance level. Setting stop-loss orders just beyond the extremes of the doji’s upper or lower shadows can help manage risk. This approach allows traders to minimize losses if the market moves against their position.
Another effective strategy involves employing profit targets to secure gains. Once a trade is initiated based on a long legged doji signal, traders can establish profit targets at recent highs or lows, depending on the direction of the trade. This ensures that profits are realized before any potential reversal occurs. Comparing the long legged doji with other candlestick patterns, such as the engulfing pattern or the hammer, can offer additional context for making informed decisions. While the long legged doji signifies indecision, the engulfing pattern typically suggests a stronger leading momentum, providing traders with a clearer indication of potential future price movements.
Ultimately, incorporating long legged dojis into a broader trading strategy enhances the ability to assess market sentiment and execute trades. Alongside technical analysis, understanding the psychological aspects behind candle patterns can improve trading outcomes significantly.
Real-Life Examples and Case Studies
The long legged doji is a formidable candlestick pattern that signifies indecision in the market, and analyzing real-life examples can enhance our understanding of its practical applications in trading. One notable occurrence can be observed in the stock market during the aftermath of significant earnings announcements. For instance, in January 2020, shares of Company XYZ experienced a long legged doji on their daily chart immediately following an earnings report that fell short of market expectations. As traders identified this pattern, many chose to adopt a cautious approach, leading to a significant price correction shortly after.
In the forex market, a case study can be examined where the EUR/USD currency pair formed a long legged doji during a high-impact news release concerning employment figures in the United States. The doji indicated uncertainty among traders regarding the future direction of the pair. Following the formation of this pattern, many traders opted to wait for confirmation before entering positions, resulting in substantial volatility over the subsequent sessions. This illustrates the importance of waiting for additional signals before making trading decisions based solely on the presence of a long legged doji.
The commodities market provides another compelling example. In mid-2021, the price of crude oil created a long legged doji on the weekly chart during a period of rising supply concerns and fluctuating demand forecasts. Traders recognized this pattern as a warning sign of market indecision. Consequently, many opted to implement stop-loss orders, effectively managing risk as the market eventually broke in favor of a downward trend. In analyzing these instances, it becomes evident that the long legged doji can serve as a valuable indicator, prompting traders to evaluate their strategies and adapt to market conditions dynamically.
FAQs
Q1. What is a Long-Legged Doji?
A Long-Legged Doji is a candlestick pattern with the following features:
- Open and Close: Nearly the same price.
- Long Upper and Lower Shadows: Indicates significant price movement in both directions during the session, but closes near the opening price.
Q2. What does a Long-Legged Doji signify?
It signals indecision in the market as neither buyers nor sellers are in control. The pattern can precede reversals or continuations, depending on the context.
Q3. Where does the Long-Legged Doji typically form?
- At the Top of an Uptrend: Signals potential bearish reversal.
- At the Bottom of a Downtrend: Indicates potential bullish reversal.
- In a Consolidation Phase: Reflects indecision or market hesitation.
Q4. Is the Long-Legged Doji a reversal pattern?
Not always. It shows indecision, and the subsequent price action determines whether a reversal or continuation follows.
Q5. How do I confirm a Long-Legged Doji pattern?
- Look for a strong candle following the Doji:
- Bullish Candle: Confirms a bullish reversal.
- Bearish Candle: Confirms a bearish reversal.
Q6. How reliable is the Long-Legged Doji?
Its reliability depends on:
- Market trend and context.
- Volume during its formation (higher volume increases reliability).
- Confirmation from subsequent candles.
Q7. Can a Long-Legged Doji form in any time frame?
Yes, it can appear in any time frame, but patterns on higher time frames (e.g., daily or weekly charts) carry more weight.
Q8. What role does volume play in a Long-Legged Doji?
- High Volume: Indicates strong indecision, likely leading to a decisive move.
- Low Volume: May reflect weak market activity, reducing reliability.
Q9. How do I trade a Long-Legged Doji?
- Wait for Confirmation: Do not act on the Doji alone.
- Entry Point: Enter in the direction of the confirmed breakout (above/below the Doji).
- Stop-Loss: Place a stop-loss just above or below the Doji’s range.
Q10. What causes a Long-Legged Doji to form?
The market sees significant buying and selling pressure during the session, but neither side wins, leading to a close near the opening price.
Q11. How does a Long-Legged Doji interact with support and resistance?
- At Support: May signal a bullish reversal if followed by a bullish candle.
- At Resistance: Indicates hesitation and potential bearish reversal.
Q12. Can the Long-Legged Doji appear in a sideways market?
Yes, it often reflects indecision or consolidation in such scenarios. Subsequent breakout direction determines the next trend.
Q13. What’s the significance of the shadow lengths?
- Long Shadows: Reflect heightened market volatility and strong indecision.
- Shorter Shadows: Suggest reduced volatility and weaker market activity.
Q14. How does the Long-Legged Doji differ from a regular Doji?
A Long-Legged Doji has much longer upper and lower shadows than a standard Doji, highlighting more pronounced market indecision.
Q15. Can the Long-Legged Doji fail?
Yes, it can fail if:
- The market trend is too strong, and indecision is overpowered by the prevailing momentum.
- There’s no confirmation candle, making the pattern meaningless.
Q16. How does RSI affect the interpretation of a Long-Legged Doji?
- In Overbought Territory (>70): Adds weight to a bearish reversal signal.
- In Oversold Territory (<30): Strengthens a bullish reversal signal.
Q17. Can a Long-Legged Doji lead to continuation?
Yes, especially in strong trends, the Doji may act as a pause before the prevailing trend resumes.
Q18. How does the Long-Legged Doji compare to a Spinning Top?
- Long-Legged Doji: Open and close are nearly the same, with long shadows.
- Spinning Top: Has a small real body with smaller wicks, indicating lesser indecision.
Q19. Is the Long-Legged Doji effective in all markets?
Yes, it’s effective across all asset classes (stocks, forex, commodities, and cryptocurrencies) as it’s based on price action.
Q20. What’s the best strategy to trade the Long-Legged Doji?
- Combine it with support/resistance, trendlines, and indicators like RSI or MACD for added confirmation.
- Always wait for the next candle’s direction to confirm the breakout or reversal.
Q21. How does the Long-Legged Doji work in trending markets?
- Uptrend: Indicates potential reversal or hesitation at resistance.
- Downtrend: Suggests potential reversal or hesitation near support.
Q22. What role do trendlines play in trading a Long-Legged Doji?
- A Long-Legged Doji near a trendline may signal a breakout or reversal depending on the subsequent price action.
Q23. Can multiple Long-Legged Dojis occur in a row?
Yes, this may indicate prolonged indecision or a consolidating market. The eventual breakout direction becomes significant.
Q24. How does a Long-Legged Doji compare to a Dragonfly or Gravestone Doji?
- Dragonfly Doji: Long lower shadow, bullish reversal at the bottom of a trend.
- Gravestone Doji: Long upper shadow, bearish reversal at the top of a trend.
- Long-Legged Doji: Long shadows on both sides, indicating indecision.
Q25. Can the Long-Legged Doji predict volatility?
Yes, the significant price movement during its formation often precedes increased volatility and a decisive breakout.